Reverse Engineering
The major question we were trying to answer in this project was how a machine's systems work together to perform its function. To answer this question, we used the reverse engineering process to take apart an item of our choice and analyze how it worked. First, we each took apart an item. Mine was a remote for a Bose sound system. Next, we formed groups and picked one person's item to focus on. My group chose a TI-30 XII calculator as our item.
We followed a series of steps in the reverse engineering process to complete the project. The first step was to come up with a purpose. My individual purpose was to analyze how pressing a button on the remote sends a signal to the sound system. My group's purpose was very similar: to analyze how a calculator computes an output when an input is typed in. Then, we each made a hypothesis and took apart our own items. After taking them apart, we individually made conceptual sketches that included diagrams of the item, a flow chart showing how it works, and analysis of the materials, energy, motion, and information. One group member's conceptual sketch became the basis of the group presentation. We completed a detailed functional, structural, material, and manufacturing analysis of the calculator.
The final product was a written report and a visual presentation. The report contained our purpose, hypothesis, photos of the disassembly, analysis of the item, and a conclusion. Since all of this is in paragraph form, we created a Google Slides presentation to show our information to the class. It included all of the same things as the report, but in a more visually pleasing form. We also added labels to the photos and a visual representation of the calculator's function.
The report, the presentation, and my individual conceptual sketch can be found below.
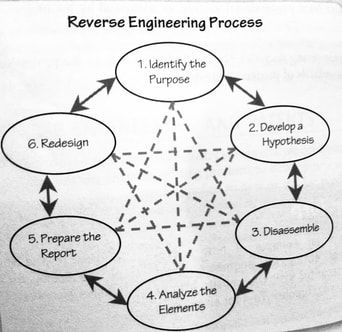
A diagram of the reverse engineering process.
Key Concepts
Reverse Engineering- Taking apart an analyzing the function of an object in order to redesign it or build a similar object. This was the overall purpose of our project, and we did it by taking apart our item and researching how the components work together. We also used the reverse engineering process as a guide to construct our report.
Conceptual Sketch- Freehand sketches done by engineers that show how an item works. They often include a flow chart or some other visual aid to explain the connections between various parts of the item. In this project, making a conceptual sketch was the first thing we did after we took apart our items. The sketches helped us to know what we needed to research and laid the groundwork for the rest of the project. Another subject area that this concept can be used in in architecture.
Flow Chart- A diagram of the sequence of movements involved in a complex system or group of systems. In this project, flow charts were used to visually show the sequence of events that leads to the final function of an item. For example, we used one to show how pressing a button on a calculator eventually leads to an output being shown on a screen.
Gantt Chart- A chart where a series of horizontal lines placed next to a schedule shows how much work is planned for a period of time and how much work has gotten done and how much is planned for a certain period of time. We used Gantt charts as a schedule for our projects. Gantt charts are used in any subject area that requires extensive planning, not just engineering.
Invention- Something is an invention when the design process results in something new or unique. We did not make use of invention in our project, since our model of calculator is not unique and we did not create anything unique through this project.
Innovation- Something is an innovation when the design process results in an improvement or modification of something that already exists. Reverse engineering often leads to innovation because taking apart an item often leads to ideas for how to improve its design.
Functional Analysis- Analysis of the function of an object's different parts, how they work together, and the scientific principles that explain their function. We used functional analysis in our report to list all of our materials and explain how each of them worked, especially the calculator's microprocessor and printed circuit board.
Structural Analysis- Analysis of how an object's different parts are connected together. In our report, we talked about the external connections such as the plastic housing and screws as well as the internal connections through the printed circuit board. We also addressed the protectiveness and transportability of the plastic casing.
Material Analysis- Analysis of the materials used and their properties. The main use of material analysis in our report was talking about the copper used in the printed circuit board, which we found to be the best metal to use because it has the highest conductivity of all non-precious metals (precious metals would not be better because they are too expensive).
Manufacturing Analysis- Analysis of the transformation of raw materials into the finished product. In our report, we wrote a detailed analysis of the manufacturing of the printed circuit board, which is the main component of the calculator we were taking apart. We found that it was made using forming methods (reshaping a material into its desired form) and joining methods (putting two or more components together).
Hypothesis- An assumption or proposed idea that is made at the start of the project to use as a jumping off point and revisited in the conclusion. We hypothesized that pressing a button on the calculator led to a specific signal being transmitted through the circuit board and displaying an output on the LCD screen. Our hypothesis was correct, and we learned more about how exactly this process works.
System- A set of connected parts forming a complex whole. A calculator is made up of many different subsystems that work together to form the entire system.
Reflection
Several things went very well during this project. First, our group divided up work efficiently and worked well together. Two of us worked on the written report, and two of us worked on the visual presentation. All four of us worked together on our research so we could keep continuity between the two parts of the report. This division of labor allowed us to work more efficiently on the project, since we could work on both aspects of the report at once instead of having to finish one before starting the other. This made the process much easier. Another thing that went well during this project was the disassembly process. Each group member initially had a different item, and we were all able to take them apart and create a detailed sketch. We also each did some initial research on our item. This gave us a blueprint to follow for the next stage of our report. Since we all had good research, we were able to choose which item we found the most interesting and focus on that one.
Although there were parts of this project that went very well, there were also some parts that went poorly. One of these things was our time management. For the first week we had to work on the project, we spent most of our time in class procrastinating or working on our resumes. This meant that we were very rushed to complete this project, which led to some unfinished parts. We never had time to contact the manufacturer, come up with a project redesign, or find schematics of our item. If we has worked harder during the first week, this would not have been a problem. Another thing that went poorly was our communication. We didn't all have each other's phone numbers, which made it very hard to get in touch with each other outside of school. Because of this, there was confusion about who was supposed to do what and when it was supposed to be done. Next time, I will suggest creating a group chat so we can communicate better.
One thing I learned from this project was that every minute counts when we are working on multiple projects at once. If I had worked on this project at the same time as the resume project instead of waiting until I was finished, I would not have had as many time issues. I could have easily worked on both at the same time, and I will do better in that regard from now on. A second thing I learned was leadership skills. Since I happened to have the more free time than my partner for the written report that week, I led the effort to write it and blocked out things for my partner to do when she had the time. I will take the leadership skills I have learned into future projects.
Written Report:
Visual Presentation:
Conceptual sketch:
